November Market Statistics for McLean, Virginia 22101
| Statistic | Values | YoY | MoM |
| Total Sold Dollar Volume | $39,912,456 | 29.06% | 78.61% |
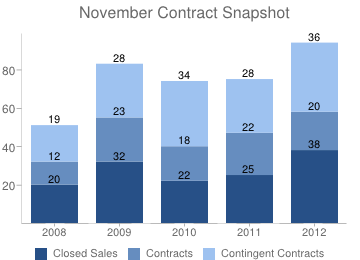
| Closed Sales | 38 | 52% | 65.22% |
| Median Sold Price | $901,500 | 7.07% | 9.94% |
| Avg Sold Price | $1,050,328 | -15.09% | 8.11% |
| Avg Days on Market | 57 days | -25% | 5.56% |
| Avg Sold to Orig List Ratio | 96.35% | 0.28% | 2.09% |
| Inventory | |||
| November 2012 | November 2011 | % Change | |
| Active Listings | 123 | 143 | -13.99% |
| New Listings | 46 | 28 | -64.29% |
| New Under Contracts | 11 | 12 | -8.33% |
| New Contingents | 26 | 17 | 52.94% |
| New Pendings | 37 | 29 | 27.59% |
| All Pendings | 56 | 50 | 12.00% |
For more information on the McLean real estate market, please contact Tania Hosmer at TaniaHosmer@gmail.com or (703) 403-8225

0 Responses to “November Statistics for Mclean, Va 22101”