There is a popular saying among top economists: “As goes housing, so goes the economy.”
Normally, nationwide housing and housing-related services account for about 15-19% of the Gross Domestic Product (GDP), depending on the year. However, broad generalizations such as: “It’s a great time to sell,” don’t even begin to tell the whole story, particularly in Northern Virginia. In order to fully understand our local housing market, the statistics need to be broken down into meaningful components which can be understood and applied by the average home owner and potential buyer.
This analysis provides a snapshot in time of our constantly changing local real estate market. Hopefully, it will provide you with a more detailed and accurate picture of what is happening in our market today.
State of the Housing Market – 9/30/13 – 3/31/13 – McLean, Virginia 22101
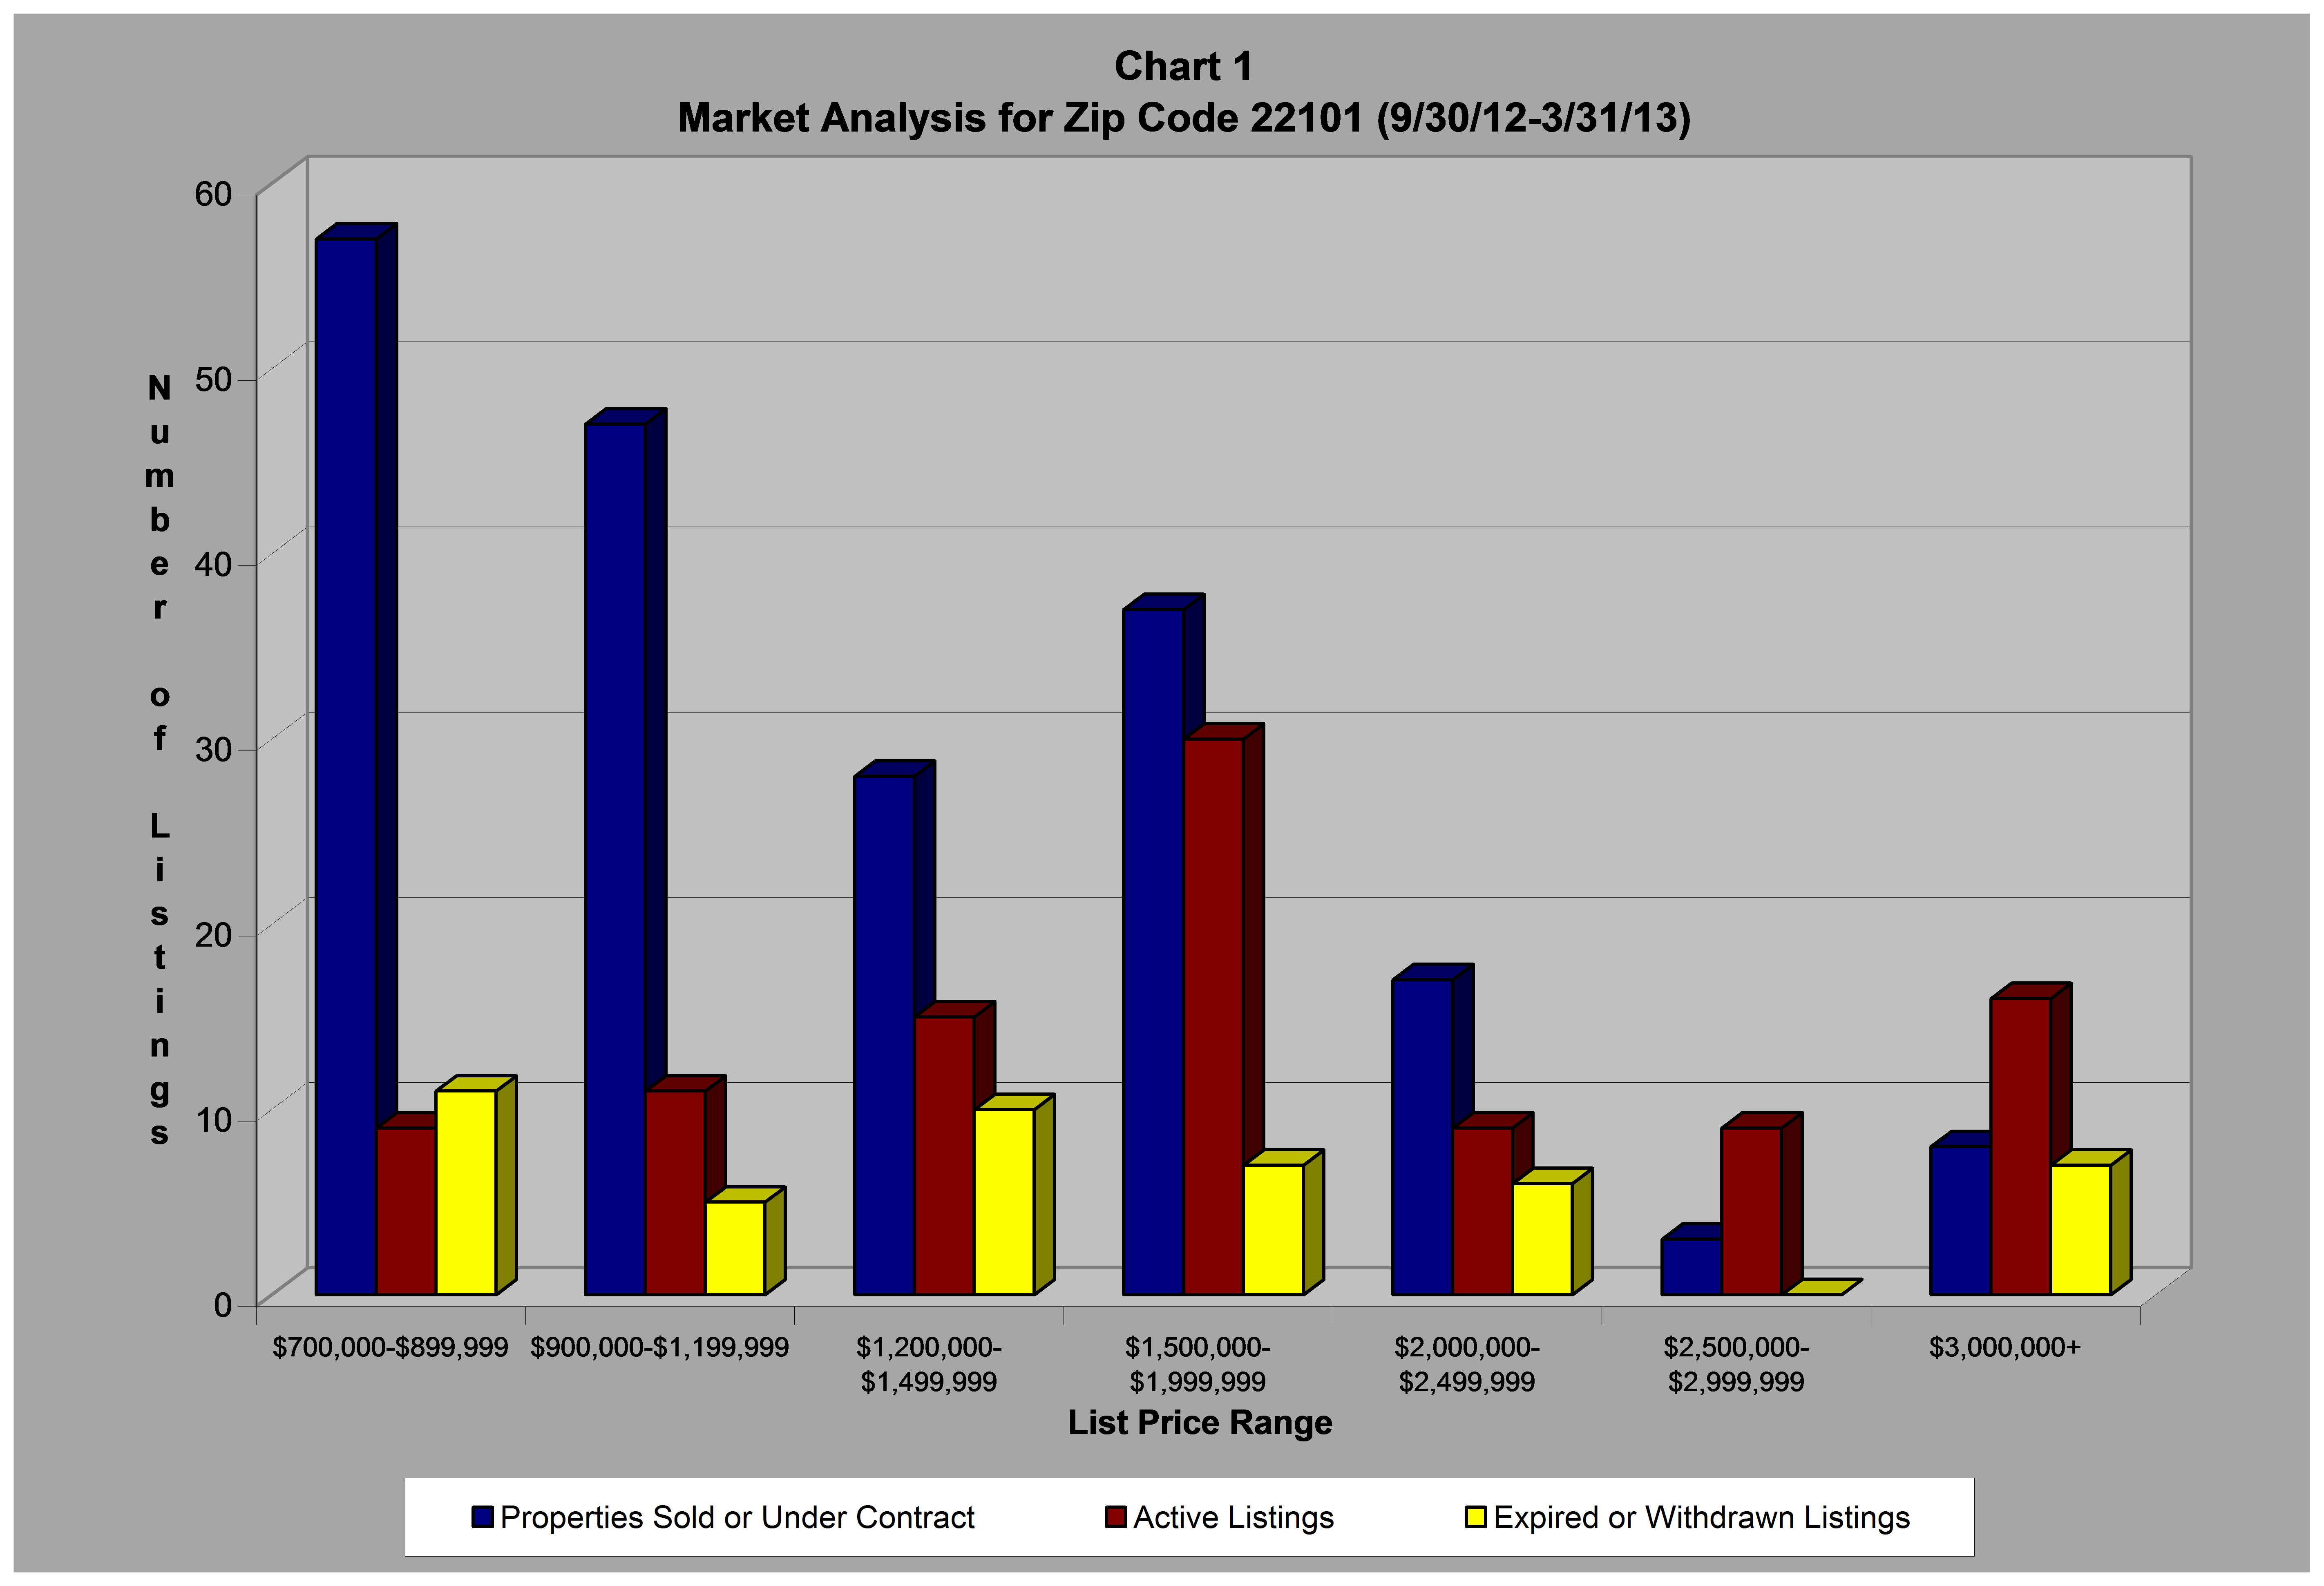
The following table and chart compare the number of active listings (the supply) to the number of properties sold or under contract (the demand) in the local real estate market of McLean, VA for zip code 22101 by price range for the period from 9/30/12 – 3/31/13.
Based on the current data, the real estate markets in our area can be characterized in one of the three ways:
Buyers’ Market – More Active Listings (Supply) than Sales and Under Contract Listings (Demand)
Balanced Market – An Equal Number of Active Listings (Supply) vs. Sales and Under Contract Listings (Demand)
Sellers’ Market – More Sold and Under Contract Listings (Demand) than Active Listings (Supply)
| Solds + | Expireds + | |||||||
| Contracts | Withdrawns | |||||||
| Type of | (9/30/12- | Active | (9/30/12- | |||||
| List Price Range | Market | 3/31/13) | Listings | Difference | 3/31/13) | |||
| $700,000-$899,999 | Sellers | 57 | 9 | 48 | or | 84% | 11 | |
| $900,000-$1,199,999 | Sellers | 47 | 11 | 36 | or | 77% | 5 | |
| $1,200,000-$1,499,999 | Sellers | 28 | 15 | 13 | or | 46% | 10 | |
| $1,500,000-$1,999,999 | Sellers | 37 | 30 | 7 | or | 19% | 7 | |
| $2,000,000-$2,499,999 | Sellers | 17 | 9 | 8 | or | 47% | 6 | |
| $2,500,000-$2,999,999 | Buyers | 3 | 9 | -6 | or | -200% | 0 | |
| $3,000,000+ | Buyers | 8 | 16 | -8 | or | -100% | 7 | |
Summary of Zip Code 22101
$700,000 – $899,999 – Sellers’ Market. The number of homes sold between 9/30/13 and 3/31/13 combined with the number of properties currently under contract is more than 6 times the number of homes currently on the market. If the expired or withdrawn listings went back on the market, the number of sold properties plus under contract properties would still be almost 3 times the number of homes listed for sale properties, and this price range would still be a sellers’ market.
$900,000 – $1,199,999 – Sellers’ Market. The number of homes that sold between 9/30/13 and 3/31/13 plus the number of currently under contract properties is more than 4 times the number of homes currently listed for sale. If you factor in the homes that were withdrawn from the market and the listings that expired, the number of sold properties plus under contract properties would still be almost 3 times the number of currently listed properties, and the price range would still be a sellers’ market.
$1,200,000 – $1,499,999 – Sellers’ Market. The number of homes that sold between 9/30/13 and 3/31/13 plus the number of currently under contract properties is almost 2 times the number of homes currently listed for sale. If you factor in the 10 properties that were withdrawn from the market or listings that expired, this price range would shift closer to a balanced market.
$1,500,000 – $1,999,999 – Sellers’ Market. The number of homes currently on the market is slightly less than the number of homes sold between 9/30/13 and 3/31/13 and under contract properties combined. If you factor in the 7 property listings that were withdrawn or expired, this price range would be balanced.
$2,000,000 – $2,499,999 – Sellers’ Market. The number of homes currently on the market is almost half the number of properties that sold between 9/30/13 and 3/31/13 combined with the number of homes currently under contract. If you factor in the 6 property listings that were withdrawn or expired, this price range would be closer to a balanced market.
$2,500,000 – $2,999,999 – Buyers’ Market. The number of homes currently listed for sale is exactly 3 times the number of homes sold between 9/30/13 and 3/31/13 plus the number of properties currently under contract. There were no property listings that expired or were withdrawn from the market in this price range between 9/30/12 and 3/31/13.
$3,000,000 and up – Buyers’ Market. The number of homes currently for sale is exactly 2 times the number of properties sold between 9/30/13 and 3/31/13 and the number of currently under contract listings combined. The 7 withdrawn and expired listings, if they were put back on the market, would make the number of active listings almost 3 times the number of sold plus under contract listings and would make this price range a stronger buyers’ market.
If you have any questions on any of the housing market information or data, please do not hesitate to call 703 403-8225 or email me at taniahosmer@gmail.com.

0 Responses to “State of the Housing Market, McLean, Virginia 22101 – September 30, 2012 to March 31, 2013”